Determining the validity of an address, especially in ecommerce, is necessary for shipping goods or authorizing a purchase, as well as detecting fraud. Larger and more sophisticated merchants with historical data assess risk based on address characteristics and past outcomes. For example, postcodes with historically high fraud rates may be flagged for further review or auto-rejected. Yet, this type of fake shipping address risk assessment easily ends uprooted in historic biases and leads to risk decisions lacking in nuance. Good customers can get rejected at checkout or presented with additional friction, while bad actors cycle through new addresses and compromised identities with impunity.
Ekata’s Address Risk API: Our team recognized the need to assess risk with a single address input. Instead of focusing on blocked lists or intrinsic characteristics of addresses, we leveraged transaction activity data to probabilistically assess risk. Our Ekata network observes billions of transactions across our customers, which enables us to develop signals and models that help our customers weed out bad transactions in fractions of a second.
Ekata looks at what types of activity are indicative of a risky address. In our Address Risk Score alone, there are dozens of various activity signals informing risk decisions. In Address Risk API, we surfaced the most predictive features in a way that is easy to understand and integrate. Below are five of the activity signals that consistently yield stellar results for our customers.
#1: Velocity | High-Activity Addresses
When targeting an e-commerce company, fraudsters may look to use easy drop-off addresses to ship goods to. To avoid fraud detection systems that look at high order values they will generally look at a large number of low-value transactions spread out over a relatively long period. This leads to an address with a high velocity of activity over a 90 day period (generally the term in which a chargeback is identified).
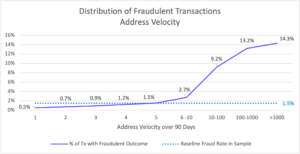
Based on the analysis of a broad range of e-commerce customers, we see fraud rates that are 6 to 9.5 times higher for addresses with a 90-day velocity of 10 or more compared to low-velocity addresses.

As the above chart shows, Ekata sees much higher fraud rates compared to average (1.49%) when we see a 90-day address velocity of 10 or more.
#2: Popularity | Use of Addresses Across a Range of Merchants/Companies
Velocity alone will provide value in fighting fraud, but it will also have a high number of false positives – for example, delivery points for a large office building. Popularity provides a view of how many different companies have seen this address interact with their systems.
Because there are a limited number of physical addresses in the world, a compromised or fraudulent address will be used several times to target as high a number of target companies as possible. For example, if you are a fraudster and have access to a compromised credit card, you will try multiple purchases on e-commerce site A until they recognize the fraud activity and block you. The next step is to move to e-commerce site B, food delivery C, marketplace D until you exhaust the card’s usage.
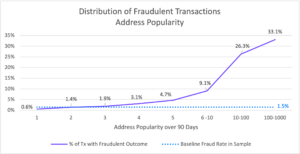
Ekata aims to minimize the impact of this activity by leveraging its popularity data point. When Ekata sees an address with more than 5 companies associated with it, the fraud rate increases by at least a factor of 6 compared to average transactions.

(Note: Avg. fraud rate of 1.49% – >5 popularity shows 9.1 fraud rate and upwards)
#3: Volatility: Inconsistent Address & Identity Combinations
Leveraging the Ekata network of name, phone, email, IP & address data, volatility looks at the number of identity element combinations a given address has been associated with. This helps to identify compromised & fraudulent addresses used with a variety of different synthetic identities.

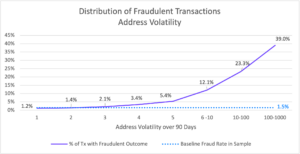
Across the Ekata network, addresses with a volatility of 10 or greater (i.e. seen with more than 10 different emails, names or phone numbers) have a fraud rate 15 times higher than average transactions.
#4: First & Last Seen Data: New/Unseen Addresses
The 3 network features mentioned so far (Velocity, Popularity & Volatility) combine to give really indicative signals for fraudulent activity. But we still have an issue with false positives. What about high activity good addresses that have been seen in the network for a long time?
This is where time-based features come into play: Addresses seen for the first time or that are new to the Ekata network tend to be riskier. Conversely, older addresses tend to be more trusted as we see good behavior build up over time. On average, addresses seen for over a month are less risky and can provide a good method to help reduce false positives. This approach can deliver a 40% reduction in fraud cases, compared to average transactions.
#5: Address Risk Score: Identifying Subtly Risky Addresses
Ekata’s proprietary Address Risk Score provides a comprehensive and easy-to-interpret signal for risk decisioning. The vast array of data feeding the model makes it especially useful for catching fraud in addresses that are not overtly risky.
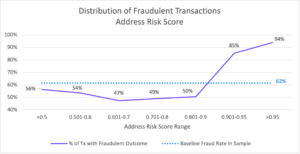
In a recent customer test, the Address Risk Score was a fantastic indicator of fraud. Most of the fraudulent transactions fell into the highest risk scores, which made it easy to set thresholds for handling these transactions. This particular customer wasn’t tracking chargebacks, though. They were dealing with a more tricky form of promotional abuse that was manifesting itself in strange address behavior around the world. The score identified these bad actors better than any other signal because it was assessing the activity and intrinsic characteristics of the addresses from multiple angles. The cost savings came from two areas: 1) lessening the work of manual review agents and 2) catching fraudulent transactions before shipping goods.
The Address Risk Score is the easiest way to holistically assess the risk of an address which is why it is used in both rules-based systems and machine learning models. The score is uniformly distributed from 0-1 which makes it easy for customers to set thresholds based on their risk tolerance and workflow. This signal is consistently in the top 3 most predictive features across all our customers.

(Note: in the chart above, the Baseline refers to the fraud baseline: 62% of all addresses they sent us in that test file were associated with fraud).
Learn more!
Ekata’s Address Verification API is designed to provide rich metadata and risk signals around any given address and help you predict whether your customer is engaging in fraudulent activity.


