


Query usage reports
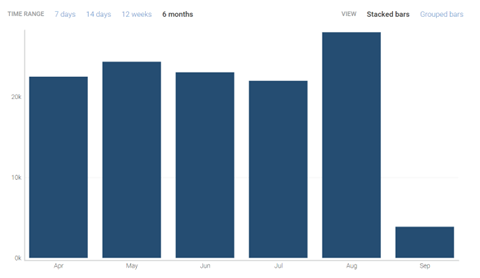
The usage reports provide an overview of total queries over a selected date range. The graphical representation of overall query volumes is used to showcase how your query usage changes over time.
You can view your usage for both your API account and your Pro Insight account. You have the ability to view it either by the last 7 days, the last 14 days, last 12 weeks or the last 6 months.
The usage reports also allow you to view usage per user or by query type. If you have multiple users, you can easily access your usage reports to see who are the heaviest users on your account, along with what types of queries they are searching.
How do I access my usage reports?
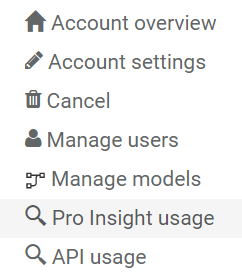
To access your API or Pro Insight usage reports, simply click on the User Actions drop-down menu in the top right corner of the page.
From there, you will see Pro Insight Usage and API Usages–click on the usage report you want.
What value will I get from the usage reports?
The usage reports gives greater control over your account, so that you are able to monitor your query usage as well as usage on a user-level.
If you have either a monthly or annual allotted block of queries, you will be able to monitor how far along you are in this block by selecting your desired date range.
How often does this get updated?
The usage report is updated every day.
How can I get a CSV of my lookups?
To obtain a CSV of your queries, scroll down to the API Query Reports By Month section, located under the usage graph.
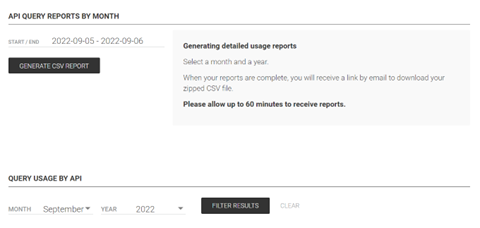
From there, you will be able to select the month and year that you want to see in more detail.
Once you have selected those, click on Generate Report to have a CSV file containing your lookups sent to the email associated with the account admin.